9篇前沿文章 | 一览肿瘤基因组及多组学思路
时间:2023-09-20 21:37:01
文章1:Genomic basis for RNA alterations in cancer
本文献已发布在上一期推文中,本文增加了大量的解释和注释(灰色和斜体字),用于辅助理解原文
接收: 2019-12-11,Nature
作者:PCAWG Transcriptome Core Group
链接:doi.org/10.1038/s41586-020-1970-0
摘 要
体细胞通常会改变癌症中转录本的变化基因组的变化所引起(Transcript alterations often result from somatic changes in cancer genomes)。(仔细理解这句话是癌症中联合转录组和基因组数据分析的理论基础。即转录(组)变化的分子机制来自基因组)
癌症描述了各种形式的癌症。RNA改变(RNA alteration),包括:过表达、可变剪接和基因融合(Overexpression, Altered splicing, Gene fusions)。(这些大多是转录组测序的研究内容,但我们往往只关注基因表达定量、差异基因鉴定、GO/KEGG等功能注释)
但由于患者之间的肿瘤类型,异质性(Heterogeneity),以及通过转录组和全基因组测序相对较小的对较小患者队列(Small cohort),很难将这些归因于潜在的基因组变化。
(这里的异质性主要指:1. 每个人的遗传差异和2. 不同取样部位、取样时间和不同细胞亚型在肿瘤组织中的差异。这些差异或异质会极大地影响肿瘤研究中的样本设置和数据分析策略。
① 肿瘤WES研究除了需要患者自己的肿瘤组织外,还需要自己的非肿瘤组织来匹配,后者是过滤掉患者独特的胚胎系统变异(即我们生来就与其他人不同DNA序列变异),否则将无法判断来自体细胞的突变 (后天获得),还是天生就有 (遗传或新突变),即:Somatic Mutation vs. Germline Mutation。公共数据库不记录患者的先天遗传变异,因此患者自身的正常组织总是需要配对。
② 在大多数情况下,体细胞突变是随机的。因此,同一肿瘤组织一般可分为不同的细胞亚群,包括不同的驱动突变,然后有不同的转录表达 (这是空间异质性。肿瘤的演变/进化研究可能涉及时间异质性,如晚期癌症转移组织或服用靶向药物一年后的耐药性突变组织等。
但总的来说,我们认为不同的器官、组织和细胞携带相同的遗传物质,即:Germline突变不受材料的影响,可以是癌症、全血、白细胞甚至口腔脱落细胞;肿瘤细胞样本的材料要复杂得多,需要考虑:正常的组织匹配、时间和空间异质性。
由于异质性的存在,需要多样化的取样方法和较大的总样本量 (即较大的患者队列),获得更可信的分子机制预测结果)
到目前为止,我们已经展示了我们所知道的最全面的癌症相关基因变化目录 (Catalogueof cancer-associated gene alterations),该目录描述了国际癌症基因组联盟(International Cancer Genome Consortium, ICGC)以及癌症基因组图谱(The Cancer Genome Atlas, TCGA)的全基因组癌症分析(Pan-Cancer Analysis of Whole Genomes, PCAWG)联盟1,188名捐赠者的肿瘤转录组获得的。
我们 (进一步)利用匹配的 (Matched)全基因组测序数据组测序数据RNA改变与胚系和体细胞DNA改变相关联 (Associated several categories of RNA alterations with germline and somatic DNAalterations),并确定了可能性遗传机制(Genetic mechanism)。
(我们发现了)细胞拷贝数改变是总基因 (Total gene)与等位基因特异性表达 (Allele-specific expression,ASE)变化主要驱动因素。
我们鉴定了649个体细胞SNV与基因表达顺式 (cis)相关性,其中68.4%与基因的侧翼非编码区相关 (Flanking non-coding region)。
我们 (还)发现1,900个与体细胞突变相关的剪接改变,包括在靠近Alu元件内含子内的外显子形成 (Formation of exons within introns in proximity to Alu elements)。
此外,82%的基因融合与结构变异相关,桥接融合包括75个新类别 (两个基因由第三个基因组连接)。
(总之)我们观察到癌症类型不同的转录组改变
引 言
为了更广泛地研究癌症基因组的改变 (特别是在非编码区),PCAWG项目的成立便是为了分析大量的全基因组样本,这些样本被贡献给ICGC和TCGA项目。
(之前)个别项目没有使用相一致的方法进行一些关键分析。因此16个PCAWG工作组的一个主要的重点是:统一地分析PCAWG数据。例如,PCAWG技术工作组领导了原始数据收集、全基因组测序数据的重新排列(比对),并实施了核心体细胞突变检测流程 (Core somatic mutation calling pipeline)。PCAWG的其它工作组集中于:对拷贝数变异、结构变异、胚系变异、突变特征和驱动基因鉴定等实施统一地分析。
在此,我们报告了PCAWG转录组工作小组对来自27种肿瘤类型的1,188个样本 (每类肿瘤154~6个样本,见下图;平均值:44)的可用且匹配的转录组和基因组图谱的联合分析 (Joint analysis of available matched transcriptome and genome profiling) (考虑到各种异质性的存在,这里的“匹配”可能是指:同一个肿瘤病人的同一块组织的匀浆液 (例如消除单块肿瘤组织的空间异质性),分别用于RNA、DNA的提取,分别进行转录组和基因组测序,即严格的“matched,匹配”。肿瘤组织 (也包含了少数转移组织)必然分别测序RNA、DNA (转录组、基因组);癌旁或其它Normal/Healthy组织可能只测序DNA (用于过滤自身的胚系变异),或也测序了RNA (用于做转录组差异分析)),提供了迄今为止我们所知的最大的癌症RNA表型及其潜在的遗传变化基础 (RNA phenotypes and their underlying genetic changes in cancer)资源 (Extended Data Fig. 1, Methods, Supplementary Results, Supplementary Table 23)。
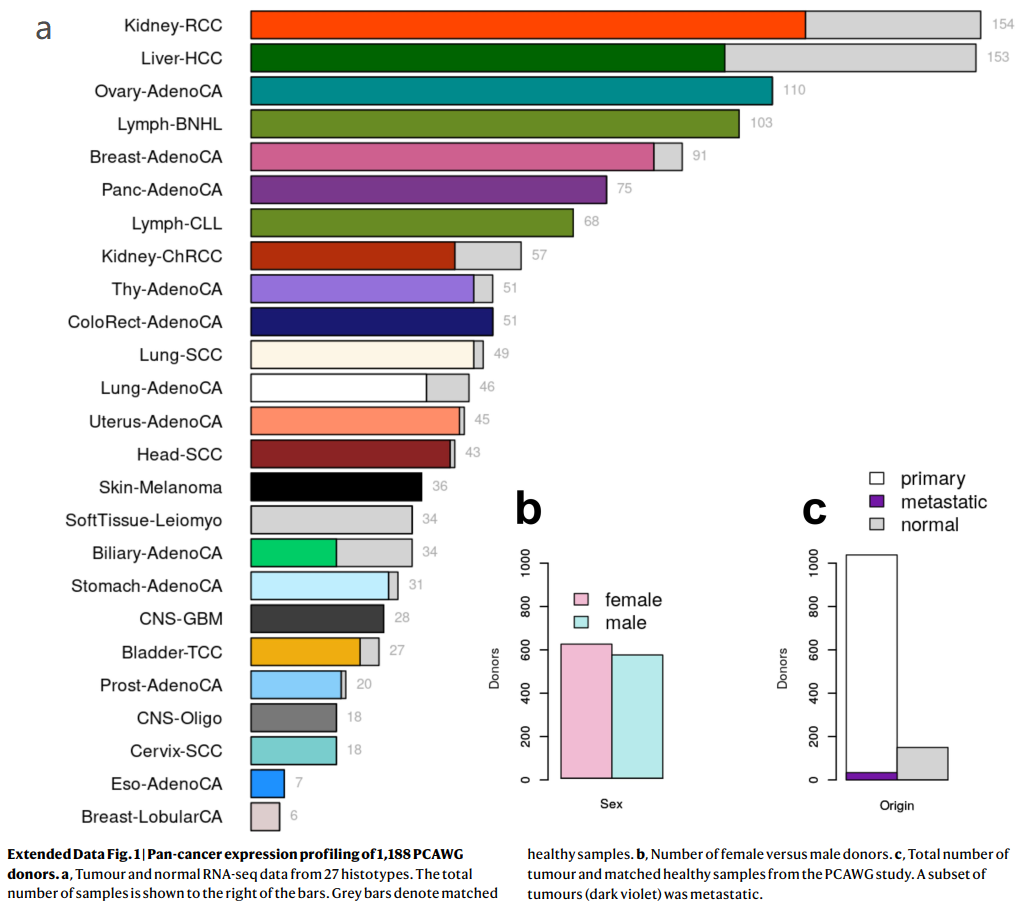
Extended Data Fig. 1 | 1,188例PCAWG捐献者的泛癌表达谱
a,来自27种组织类型的肿瘤和正常RNA-seq数据。样本总数显示在柱状图的右边。灰色条表示匹配的健康样本。
b,女性和男性捐献者的数量。
c,来自PCAWG研究的肿瘤总数和匹配的健康样本。一组肿瘤(深紫色)已转移。
S1_covars.xlsx / All_samples_cohort
Supplementary_Tables (下载):https://pan.baidu.com/s/10fTsnVYlk30T9pKIq05cHg
提取码:ysx4
总之,我们展示了转录组数据用于理解特定DNA改变的不同维度如何促进癌变的重要性,并绘制出癌症相关RNA改变的图景 (Landscape)。
癌症特异性胚系顺式-eQTLs
Cancer-specific germline cis-eQTLs
为了研究不同类型RNA改变的潜在机制,我们首先关注了基因表达水平的变化 (Extended Data Fig. 2)。
(表达数量性状位点 (Expression quantitative trait locus, eQTL)是关联转录组和基因组/外显组两个组学的常用、经典方法,属于多组学研究范畴。
eQTL是一类能够影响基因表达量的遗传位点(大部分都是单核苷酸多态性,SNP),具有一定的生物学意义。迄今为止最全的eQTL数据库是GTEx。分析SNP和基因表达水平的关联度,以及SNP与基因的距离,寻找SNP调控的基因。
Cis-eQTLs vs. trans-eQTLs. Expression quantitative trait loci (eQTLs) are genetic variants that influence expression levels of mRNA transcripts. Cis-eQTLs commonly refer to genetic variations that act on local genes , and trans-eQTLs are those that act on distant genes and genes residing on different chromosomes.
a) cis-eQTL, b) trans-eQTL, c) mediated/介导 trans-eQTL with a single cis-mediator, and d) mediated/介导 trans-eQTL with multiple cis-mediators. 清华大学统计科学中心,https://doi.org/10.1186/s12859-019-2651-6,BMC Bioinformatics
Identification of eQTLs can help advance our understanding of genetics and regulatory mechanisms of gene expression in various organisms. Consistent findings suggest that many genes are regulated by nearby SNPs, and the identified cis-eQTLs are typically close to transcription start sites (TSSs). In contrast to cis-eQTLs, trans-eQTL identification is much more challenging because a greater number of SNP-gene pairs are tested for trans-association. In order to achieve the same power, analysis of trans-eQTLs requires a much larger sample size and/or effect than that in the cis-eQTL analysis. However, trans-eQTLs tend to have weaker effects than cis-eQTLs.
Mediation diagram of the trans-association between rs2239804 and RPL34
Several methods have been developed to improve trans-eQTL detection, such as reducing the multiple-testing burden based on pairwise partial correlations from the gene expression data to increase power, and constructing or selecting variables to control for unmeasured confounders that may lead to spurious association
eQTL分析至少需要三个文件:第1个是样本信息文件,该文件包含样本的年龄,性别和人种等等;第2个是基因表达量文件,它表示的是每个基因在每个样本中的表达含量;第3个是基因型数据,也即每个样本的基因型数据)
Extended Data Fig. 2 | 概述:在分析中考虑的遗传变异的不同来源
a, 为了分析顺式调控,使用标准eQTL方法,分别检测单等位、单核苷酸 (Mono-allelic single-nucleotide)胚系变异 (SNV,蓝色)与总基因表达 (Total gene expression)的关联。(蓝色圆点SNV,在样本中存在完全相同的基因组位置;上图的示例有3处)
由于体细胞SNV在队列中复发率较低 (Low recurrence,红色圆点SNV,在样本中不存在完全相同的基因组位置;上图的示例有0处),根据它们相对于所观测的基因的位置 (例如启动子、5 ' UTR或内含子),体细胞SNV被聚集在负荷分类中 (Aggregated in burden categories) (例如上图的“Local somatic SNV burden/局部体细胞SNV负荷”)。
然后使用eQTL方法测试局部SNV负荷,获取与所有基因的ASE/等位基因特异性表达 globally关联,以及在每个基因水平上的总表达。通过检测与突变及表观遗传特征相关的总基因表达,来估计反式效应 (Trans effects)。
所有体细胞顺式eQTL分析的窗口大小为1 Mb;ASE及胚系顺式eQTL分析的窗口大小为100 kb。
b,概述:不同的数据集,及其对a中所述分析的贡献。箭头表示所执行的单个分析之间的依赖关系。
① 胚系基因型来源于匹配的 (Matched)健康全基因组测序 (WGS)样本。
② 等位基因特异性SCNAs (体细胞拷贝数改变)、突变特征和局部SNV负荷,来自于:与未受影响的 (Unaffected) WGS样本相比的肿瘤WGS (即N-T配对)。
③ ASE和总表达 (Total expression/FPKM)来自肿瘤和正常RNA-seq数据。
我们最初考虑了常见的胚系变异 (次要等位基因频率 (Minor allele frequency, MAF)≥1%),且靠近单个基因 (±100 kb),并在队列中绘制了表达定量性状位点 (eQTL) (Extended Data Fig. 3, Supplementary Table 1)。
该泛癌分析发现了3,532个eQTL基因 (假发现率即FDR≤5%,以下表示为eGenes) (Supplementary Table 2),富集于转录起始位点的近端区域 (TSSs) (Extended Data Fig. 3)。
Supplementary_Tables / S2_eGenes_v2.xlsx / pan-analysis
Extended Data Fig. 3 | 胚系eQTL中的先导变异 (Lead variants)
(每一行的3个子图是一类肿瘤,3个图是eQTL分析常见的输出图形,主要涉及:P值、先导SNP的个数及其与TSS的距离)
为了识别癌症特异性调控变异,我们将我们的eQTL与来自基因型-组织表达项目 (GTEx,数据一般来自健康组织)的eQTL进行比较,采用之前的策略来评估eQTL的Replication,并探索先导eQTL变异在GTEx组织中的边缘显著性 (Marginal significance. P≤0.01, Bonferroni-adjusted)。
尽管大多数先导变异在GTEx样本中都能检测到 (3,532个eQTL变异中有3,110个),但我们鉴定出了422个 (~8.4%)与GTEx组织不对应的eQTL,这提示了存在癌症特异性调控 (Extended Data Fig. 4, Supplementary Table 3)。相应的eQTL先导变异富集于异染色质区 (Heterochromatic region) (Fig. 1a,图中右侧第2个显著性星号:* )。
Fig. 1 | 与基因表达关联的胚系及体细胞SNV
a,表观遗传学路线图 (Epigenetics Roadmap)富集分析,显示泛分析/Pan-analysis的PCAWG特异性eQTLs,以及在GTEx组织中复现/Replicate的eQTLs中,跨细胞系Roadmap因素/Factos的平均倍数变化。
* :P < 0.05/25, PCAWG特异性eQTLs的单侧Wilcoxon秩和检验,校正了所使用的Roadmap因子的数量 (即25)。数据为均值和标准差.
(其它几个子图,将在后文讲解)
总的来说,这一分析揭示了基因表达调控的胚系框架 (Germline framework)在癌症组织中很大程度上是保守的。
非编码区体细胞顺式eQTL
Somatic cis-eQTLs in non-coding regions
先前的其它研究已经描述了癌症中的非编码突变,特别是在启动子区,及其对基因表达的调控作用。在这里,我们研究了整个基因组中可能的体细胞DNA变化,这些变化是基因表达变化的基础。
Extended Data Fig. 5 | 顺式突变体细胞负荷 (Cis-mutational somatic burden)
a,每种癌症类型的体细胞突变负荷总数 (Total number of somatic mutational load per cancer type)。SNV的中位数范围从甲状腺腺癌的1,139个到皮肤黑色素瘤的72,804个。
(此图也可以用于绘制肿瘤样本分类或分组后,各自体细胞突变负荷总数的分布图)
(横轴) Shared Aliquots (共享的整除数)
b,由越来越多的患者共享的反复出现的体细胞SNV的数量。一小部分 (≥86个SNV)在超过1%的队列 (≥12例患者)中均被检测到。
(此图可由变异水平的各样本的SNV矩阵 (热图)/VCF文件,统计得到)
我们通过聚集 (Aggregating)基因附近 (侧翼)2 kb区间 (2-kb intervals adjacent to genes, flanking)的SNV,以及处在外显子、内含子中的SNV (Extended Data Figs. 2, 5, 6),来估计局部突变负荷 (Estimat local mutation burden)。
Extended Data Fig. 6 | 按检测区域类型划分的体细胞突变率与负荷频率 (Mutation rate and burden frequency)
a,每个基因检测到的、体细胞突变负荷频率≥1%的、突变区域的个数;
b,每千碱基的突变率 (Mutation rate per kilobase)。
c,按所测间隔类型划分的 (侧翼区、外显子、内含子)负荷频率。
d,前导间隔 (Leading intervals, FDR≤5%)到其最近的 (左和右)间隔的距离分布 (bp),使其关联的P值下降了至少一个数量级 (显示了99%的分布)。
e,检测的所有的基因组区域 (负荷频率≥1%,n = 1,049,102),以及所观察到的FDR为5%的体细胞顺式eQTL下的567个基因组区域的分解 (Breakdown)。图中,Intronic:eGene内含子;Exonic:eGene外显子;Flank.:表示距离eGene起始和结束1Mb距离内的2kb侧翼区域;flank.intergenic:指基因组位置 (无基因注释)的侧翼区域;Flank.intronic:指与邻近基因内含子重叠的侧翼区域;Flank.others:表示与附近基因的一些注释部分地重叠的侧翼区域。
接下来,我们分解 (Decomposed)了单个基因的表达变化,考虑了顺式基因中常见的突变负荷,以及顺式胚系变异和体细胞拷贝数改变 (SCNAs)。这表明SCNAs是表达变化的主要驱动因素 (17%),其次是基因侧翼区域的体细胞SNV (1.8%)和胚系变异 (1.3%) (Fig. 1b)。
Fig. 1b
b,对基因表达水平进行方差成分分析 (Variance component analysis),显示不同种系和体细胞因素,对不同基因集的方差所占的平均比例 (Average proportion of variance explained by different germline and somatic factors for different sets of genes),包括所有因子的平均效应:
1)所有遗传因子 (包括种系和体细胞);2)体细胞拷贝数变异;3)侧翼区的体细胞变异;4)人群结构;5) cis-germline effects;6)体细胞内含子和外显子突变效应。
(可见:体细胞的内含子和外显子突变效应的解释度很小,而主要由拷贝数变异、非编码区和顺式胚系等变异所解释)
我们还测试了所有常见突变负荷与整个基因组的基因表达之间的关联。我们鉴定了649个具有体细胞eQTL (FDR≤5%)的基因 (Supplementary Table 5)。其中,11个关联结果位于相应eGene的内含子或外显子,包括在特定癌症发病机制中已知存在作用的基因,如卵巢癌中的CDK12和慢性淋巴细胞白血病中的IRF4 (Extended Data Figs. 7, 8)。
Supplementary_Tables / S5_somatic_egenes_rev.xlsx / eQTL_results_FDR5%
Extended Data Fig. 7 | 与遗传先导负荷 (Genic lead burden)相关联的7个体细胞eGenes的曼哈顿图
Extended Data Fig. 8 | 8个体细胞eGenes的散点图,显示先导权重负荷对基因表达残差的影响 (Plots show the effect of the lead weighted burden on the gene expression residuals (见原文的Methods) of these genes. a, CDK12. b, PI4KA. c, IRF4. d, AICDA. e, C11orf73. f, BCL2. g, SGK1. h, TEKT5
大多数eQTL (68.4%)与侧翼非编码突变负荷相关 (Extended Data Fig. 6e,见上文)。(由此可见:基因组的非编码区虽然不直接体现生命活动 (蛋白),但对基因表达的调控非常重要)
接下来,我们考虑了位于侧翼区域 (n = 556)的eQTLs,并测试了来自Epigenetics Roadmap的细胞类型特异性注释的富集。确定了13个有富集的注释 (FDR≤10%) (Extended Data Fig. 9, Supplementary Table 6),包括:待发 (Poised)启动子,弱的和活跃的增强子,异染色质,但明显没有富集到转录因子结合位点 (Supplementary Table 7)。(Roadmap的这些注释可能被收集在一些带有注释的bed文件,结合本文献的数据及bedtools等工具,做进一步的统计、关联)。 转录不活跃区域的富集可能是由于这些区域的突变率增加 (Extended Data Fig. 9),这之前在癌症中有报道。
Extended Data Fig. 9 | 与存在体细胞突变负荷的侧翼间隔,有所重叠的表观基因组图谱标记 (Roadmap epigenome marks)
我们还研究了体细胞eGenes的功能特征,并观察到癌细胞testis基因的二价 (Bivalent)启动子中体细胞eQTLs的富集 (P = 0.04, Fisher’s exact test),如TEKT518 (Fig. 1c, Extended Data Fig. 8h)。
Fig. 1c
c,曼哈顿图显示TEKT5基因关联的名义 (Nominal)P值 (用灰色标出),已考虑侧翼、内含子和外显子间隔。先导体细胞负荷与TEKT5表达的增加相关 (P = 1.61 × 10e-6),并与上游二价 (Bivalent)启动子重叠 (红点;注释于:81个Roadmap细胞系,包括8个胚胎干细胞,9个胚胎干细胞来源,5个诱导多能干细胞系)。
此外,我们发现了与细胞分化和发育过程相关的基因本体 (即GO)类别的整体 (Global)富集 (FDR≤10%) (Supplementary Table 8)。总体而言,体细胞eQTL分析发现,大多数非编码区域与局部基因表达的变化相关,与癌症特异性胚系eQTL类似,显示了转录非活性区域的富集,如异染色质。
Fig. 1d, 1e
d,突变特征 (Mutational signatures, Sig)与基因表达之间的显著性关联结果总结。
顶:每1类突变特征/Signature (FDR ≤ 10%)中,关联基因的总数。
下:每1类突变特征/Signature相关的基因,其富集到的GO分类/Categories或Reactome通路 (FDR≤10%,显著性水平以颜色编码,-log10转换后的校正后的P值)。
e,仅考虑SCNAs、胚系eQTLs、编码和非编码突变,AEI (Allelic expression imbalance,非平衡等位基因表达)存在的标准效应 (Standardized effect)大小。数据是对效应大小的估计和标准误的估计。
-- 未翻译完,更多内容请查看原文;下文主要涉及:摘要、方法和部分图形解读 --
Fig. 2 | 体细胞突变对选择性剪接的位置特异性影响 (Position-specific effect of somatic mutations on alternative splicing)
a,顶部,外显子-内含子连接 (Exon–intron junctions)附近,及与外显子跳过事件 (Exon-skipping event)相关的分支位点 (Branch sites)的突变比例。具有相关剪接变化的突变是指其中:The percentage spliced in-derived |z-score| is ≥ 3 (图中的深蓝色)。星号:Intron positions significantly enriched for splicing changes relative to background based on a permutation test. *P < 0.05, **P < 0.01, ***P < 0.001。底部: sequence motifs of regions。
Fig. 2b, 2c
b,肿瘤抑制基因STK11的外显化 (Exonization)事件的例子。图的上方,对于携带变异 (Alternative/替代)等位基因的供体,基因的某部分的RNA-seq的Reads覆盖显示为红色,而对于携带参考等位基因的随机供体 (Random donor with reference allele)则显示为灰色。盒式外显子事件 (Cassette exon event)显示在图的下方。
c, Enrichment of SINE elements in SAVs (Splicing-associated variants,剪接相关变异) compared to sequence background (BG). Shown for SINE elements overlapping in sense (middle) and antisense (right) directions.
Fig. 3 | 与RNA融合相关的结构重排
a,所有检测到的和新的融合的数量,及其与癌症普查 (Census)基因的重叠部分。b、桥接融合示意图。桥接融合是由连接两个基因的第三个基因组片段形成的复合融合。在每种情况下,只描述了一种可能的基因组排列顺序,断点被突出显示为“闪电”。
Fig. 4 | 影响肿瘤的DNA和RNA变化的全局视图
a, 不同组织类型的不同改变的中位数. Histotypes are ordered by hierarchical clustering based on the pattern of different types of alteration. Alt., alternative; non-syn, non-synonymous. Cancer-type abbreviations are listed in Supplementary Table 23.
b, c, Circular representations of the selected genes significantly co-occurred with B2M (b) and PCBP2 (c). Connecting lines indicate the specific types of co-occurrence of alteration pairs. 内部直方图显示不同颜色的不同DNA/RNA变化类型的发生频率。
d, 所有74个癌症体细胞突变目录 (COSMIC)的癌症普查基因,或PCAWG驱动基因,在RNA和DNA水平的改变中、存在频繁和异质性地改变。黄条:DNA水平发生改变的样本比例,绿条:RNA水平发生改变的样本比例。(二者呈现相反的趋势,可以这么理解:肿瘤中如果一个基因已经发生了突变,则其表达与否,是次要影响因素,后者不再受癌症演变的选择;反之亦然。有些基因注定是驱动突变 (如TP53),另外一些基因则是“被动表达 (如GAS7)”,即驱动突变引起的对其它一系列基因表达调控的影响)。中间一栏:该基因观察到的每种变异类型的比例。
e, 在我们发现的显著地重复出现的基因的列表中的癌症基因的富集 (The enrichment of cancer genes within our list of significantly recurrent genes)。
文章2:综合多组学分析确定非肌肉浸润性膀胱癌 (Non-muscleinvasive bladder cancer)的预后分子亚型
接收: Nature Communications
时间/作者:2021/丹麦奥胡斯大学医院分子医学系
链接:doi.org/10.1038/s41467-021-22465-w
摘 要
非肌层浸润性膀胱癌(NMIBC)的分子特征是生物异质性大,临床结果可变。在这里,我们对诊断为NMIBC的患者(n=834)进行了多组学综合分析。转录组分析确定了反映肿瘤生物学和疾病侵袭性的四个类别(1、2a、2b和3)。基于转录组的亚型和染色体不稳定性水平提供了超出既定预后临床病理参数的独立预后价值。染色体高度不稳定性、p53通路中断和APOBEC相关突变与转录组2a类和不良预后显著相关。RNA衍生的免疫细胞浸润与染色体不稳定的肿瘤相关,并在2b类中富集。空间蛋白质组学分析证实2b类肿瘤浸润程度较高,并证明免疫细胞浸润程度较高与复发率较低之间存在关联。最后,使用单样本分类工具在1228个验证样本中记录了转录组分类的独立预后价值。该分类器为生物标记物发现和优化下一代临床试验中的治疗和监测提供了框架。
方 法
我们将先前研究中收录的438种肿瘤的RNA-Seq数据,与新的97个肿瘤RNA-Seq数据一起重分析 (Reanalyzed together )。
基于发现样本,我们创建了一个包含55名患者的BCG队列 (临床上,高危NMIBC手术后经膀胱辅助灌注 (Bacillus Calmette–Guérin, BCG)以根除残留疾病,从而减少复发和进展的频率),他们符合以下标准: (1)BCG治疗的指征是高级别疾病,(2)患者接受了至少6个BCG系列,(3) 在TURB后12个月内开始BCG治疗 (因此,对分析的肿瘤给予BCG)。利用我们数据集中的多种可用特征,利用BCG队列研究BCG失效的时间。BCG无失败生存期定义为BCG治疗后第一次出现高分级肿瘤或第一次进展至MIBC的时间。
部分图形解读
Fig. 1 Transcriptomic classes in NMIBC.
a Consensus matrix for four clusters. Samples are in both rows and columns and pairwise values range from 0 (samples never cluster together; white) to 1 (samples always cluster together; dark blue). (样本的相关性矩阵,发现聚集为4类)
b Comparison between the three UROMOL2016 transcriptomic classes and the UROMOL2021 four-cluster solution (76% of tumors in UROMOL2016 class 1 remained class 1, 92% of tumors in UROMOL2016 class 2 remained class 2a/2b and 67% of tumors in UROMOL2016 class 3 remained class 3). (样本前后分类、聚集的比较)
c Kaplan–Meier plot of progression-free survival (PFS) for 530 patients stratified by transcriptomic class. (以分组的转录组聚集分类,做无进展生存曲线;四条曲线分别对应4种分类)
d Kaplan–Meier plot of recurrence-free survival (RFS) for 511 patients stratified by transcriptomic class. (同上,无复发生存期 生存曲线)
e, f Clinicopathological information and selected gene expression signatures for all patients stratified by transcriptomic class. Samples are ordered after increasing silhouette score within each class (lowest to highest class correlation). CIS carcinoma in situ, EORTC European Organisation for Research and Treatment of Cancer, EAU European Association of Urology, MIBC muscle-invasive bladder cancer, EMT epithelial-mesenchymal transition. (转录组分类的,所有患者的临床病理信息、及选定的基因表达特征,二者的信息映射。样本在每个类别中增加轮廓分数后排序(从最低到最高类别相关性)。CIS原位癌,EORTC欧洲癌症研究和治疗组织,EAU欧洲泌尿学协会,MIBC肌肉浸润性膀胱癌,EMT上皮-间质转化) (比如EMT基因集合,在各个样本中的表达值做加和?)
g RNA-based immune score and immune-related gene expression signatures for all patients stratified by transcriptomic class. (转录组分类的所有患者的RNA免疫评分和免疫相关基因表达特征)
h Regulon activity profiles for 23 transcription factors. Samples are ordered after increasing silhouette score within each class (lowest to highest class correlation). Regulons (rows) are hierarchically clustered. (23个转录因子的调控活性图谱。样本在每个类别中增加轮廓分数后排序(从最低到最高类别相关性)。规则(行)是层级聚类的)
i Regulon activity profiles for potential regulators associated with chromatin remodeling. The most-upregulated regulons within each class are shown. Regulons are hierarchically clustered. P-values were calculated using two-sided Fisher’s exact test for categorical variables, Kruskal–Wallis rank-sum test for continuous variables and two-sided log-rank test for comparing survival curves. Source data are provided as a Source data file. (与染色质重塑相关的潜在调控因子的调控活性谱。每个类别中最受限制的规则显示出来。规则是层级聚类的。P值的计算采用分类变量的双侧Fisher精确检验,连续变量的Kruskal-Wallis秩和检验,生存曲线的比较采用双侧log-rank检验。源数据作为源数据文件提供)
图2 NMIBC中拷贝数的变化
a 根据基因组类别 (Genomic class, GC) 1-3分层的473个肿瘤的全基因组拷贝数图。增益(增益+高平衡增益)和损失(损失+高平衡损失)汇总在染色体带面板的左侧。EORTC欧洲癌症研究与治疗组织,EAU欧洲泌尿外科协会,MIBC肌肉浸润性膀胱癌。
b 426例按基因组分类的无进展生存期(PFS) Kaplan-Meier图。
c 399例按基因组分类的患者无复发生存期(RFS) Kaplan-Meier图。
d EORTC高危评分(n = 163)按基因组分类分层的患者的PFS Kaplan-Meier图。p值的计算采用双侧log-rank检验。源数据作为源数据文件提供。
Fig. 3 Genomic alterations associated with transcriptomic classes. (与转录组分类相关的基因组改变)
a Genomic classes (GCs) compared to transcriptomic classes (n = 303). 两个组学分类方式的交叉分布展示、统计检验。
b. 12-gene qPCR-based progression risk score compared to GCs. Colors indicate transcriptomic classes.
c Kaplan–Meier plot of progression-free survival (PFS) for 154 patients (including only class 2a and 2b tumors) stratified by GC.
d. Number of RNA-derived mutations according to transcriptomic classes.
e Landscape of genomic alterations according to transcriptomic classes. Samples are ordered after the combined contribution of the APOBEC-related mutational signatures. Panels: RNA-derived mutational load, relative contribution of four RNA-derived mutational signatures (inferred from 441 tumors having more than 100 single nucleotide variations), selected RNA-derived mutated genes, copy number alterations in selected disease driver genes (derived from SNP arrays). Asterisks indicate p-values below 0.05. Daggers indicate BH-adjusted p-values below 0.05.
f. Comparison of RNA-derived single nucleotide variations to whole-exome sequencing (WES) data from 38 patients for 11,016 mutations in all genes, 280 mutations in the genes most frequently mutated or differentially affected between the classes (n = 82, Supplementary Fig. 5b) and 93 mutations in 19 selected bladder cancer genes (Fig. 3e). Only mutations with > 10 reads in tumor and germline DNA were considered and a mutation was called observed when the frequency of the alternate allele was above 2%.
g. Genomic alterations significantly enriched in one transcriptomic class vs. all others.
h Overview of p53 pathway alterations for all tumors with available copy number data and RNA-Seq data (n = 303).
i Amount of genome altered according to p53 pathway alteration. intact (完好无损的)
j Number of mutations according to mutations in DNA-damage response (DDR) genes (including TP53, ATM, BRCA1, ERCC2, ATR, MDC1).
k. RNA-based immune scoreaccording to GCs.
l RNA-derived mutational load according to GCs.
m Relative contribution of the APOBEC-related mutational signaturesaccording to transcriptomic class.
(采用的统计检验方法等) P-values were calculated using two-sided Fisher’s exact test for categorical variables, Kruskal–Wallis rank-sum test for continuous variables and twosided log-rank test for comparing survival curves. For all boxplots, the center line represents the median, box hinges represent first and third quartiles and whiskers represent ± 1.5× interquartile range. Source data are provided as a Source data file.
Fig. 4 Spatial proteomics analysis of tumor immune contexture. a Multiplex immunofluorescence staining with Panel 1 (CD3, CD8, and FOXP3) of tumors with high- and low immune infiltration with magnifications of T helper cells (CD3+, CD8− and FOXP3−), a cytotoxic T lymphocyte (CTL; CD3+, CD8−, FOXP3−) and a regulatory T cell (Treg; CD3+, CD8− and FOXP3+). Yellow dashed lines divide the tumor tissue into parenchymal and stromal regions. Scale bar: 20 µm. All protein measurements were performed once for each distinct sample. b Spatial organization of immune cell infiltration and antigen recognition/escape mechanisms (MHC class 1 and PD-L1) with associated data for genomic class, transcriptomic class, and recurrence rate. The immune cells and immune evasion markers are defined as the percentage of positive cells in the different regions (stroma and parenchyma) and normalized using zscores, (1) z ¼ ðxμÞ σ . Columns are sorted by the degree of immune infiltration into the tumor parenchyma in descending order from left to right. c Immune infiltration stratified by transcriptomic class. Immune infiltration is defined as the percentage of total cells in the parenchyma classified as immune cells. The p-value was calculated using two-sided Wilcoxon rank-sum test. d Immune infiltration stratified by recurrence rate. The p-value was calculated by the one-sided Jonckheere–Terpstra test for trend. e Kaplan–Meier plot of recurrence-free survival (RFS) for patients with tumors with few genomic alterations (GC1 + 2) stratified by immune infiltration. P-value was calculated using two-sided log-rank test. f Distribution of CK5/6 and GATA3 positive carcinoma cells stratified by transcriptomic class. Each column represents a patient. The p-value reflects the difference in CK5/6 expression across classes and was calculated by chi-squared test. For boxplots, the center line represents the median, box hinges represent first and third quartiles and whiskers represent ± 1.5× interquartile range. Source data are provided as a Source data file.
Fig. 5 Prediction models and summary characteristics of classes. a Overview of hazard ratios calculated from univariate Cox regressions of progressionfree survival using clinical and molecular features. Black dots indicate hazard ratios and horizontal lines show 95% confidence intervals (CI). Asterisks indicate p-values below 0.05 and the sample sizes, n, used to derive statistics are written to the right. CIS carcinoma in situ, EORTC European Organisation for Research and Treatment of Cancer, EAU European Association of Urology. b Receiver operating characteristic (ROC) curves for predicting progression within 5 years using logistic regression models (n = 301, events = 19). Asterisks indicate significant model improvement compared to the EORTC model (Likelihood ratio test, BH-adjusted p-value below 0.05). AUC area under the curve, CI confidence interval. c Summary characteristics of the transcriptomic classes. Molecular features associated with the classes are mentioned, and suggestions for therapeutic options with potential clinical benefit are listed. MIBC muscle-invasive bladder cancer, EMT epithelial-mesenchymal transition, CTLs cytotoxic T lymphocytes. Source data are provided as a Source data file.
Fig. 6 Validation of transcriptomic classes in independent cohorts. a Summary of classification results and stage distribution for all tumors, tumors with microarray data and tumors with RNA-Seq data (1228 tumors were classified in total and 1225 of these were assigned to a class). b Association of tumor stage, tumor grade and FGFR3 and TP53 mutation status with transcriptomic classes. P-values were calculated using two-sided Fisher’s exact test. c Kaplan–Meier plot of progression-free survival (PFS) for 511 patients stratified by transcriptomic class. The p-value was calculated using two-sided logrank test. d Association of regulon activities (active vs. repressed status) with transcriptomic classes in the UROMOL cohort (including samples with positive silhouette scores, n = 505) and transcriptomic classes in the independent cohorts (pooled). The heatmap illustrates BH-adjusted p-values from two-sided Fisher’s exact tests. e Pathway enrichment scores within transcriptomic classes in the UROMOL cohort (including samples with positive silhouette scores, n = 505) and transcriptomic classes in the independent cohorts (pooled). Asterisks indicate significant association between pathway and class (one class vs. all other classes, two-sided Wilcoxon rank-sum test, BH-adjusted p-value below 0.05). Triangles indicate direction swaps of pathway enrichment in the independent cohorts compared to the UROMOL cohort. GSVA gene set variation analysis. Source data are provided as a Source data file.
文章3:多组学分析揭示肿瘤突变负荷对肝癌预后的价值
日期: 2021
期刊:Cancer Cell Int (IF=6.5)
链接:doi.org/10.1186/s12935-021-02049-w
整篇文章似乎是:转录组分析转录组,WES分析WES,二者未做关联分析
摘 要
背景: 肝细胞癌 (HCC)是世界上第6种具有高侵袭性特征的常见恶性肿瘤。肿瘤突变负荷 (Tumor mutation burden, TMB)是多种肿瘤免疫治疗反应性的指标。然而,TMB在肿瘤免疫微环境 (TIME)中的作用尚不清楚。
方法: 采用“maftools”软件包对突变数据进行分析。采用加权基因共表达网络分析(WGCNA)确定与TMB值相关的候选模块和显著基因。采用R软件包“limma”对不同水平TMB亚组进行差异分析。基因本体 (GO)富集分析采用“clusterProfiler”、“enrichment plot”和“ggplot2”软件包实现。通过系统的生物信息学分析,建立了风险评分特征。进一步分析KM生存曲线和受试者工作特征 (ROC)曲线,以判断预后的有效性。为了描述TIME的综合上下文,我们使用了XCELL、TIMER、QUANTISEQ、MCPcounter、EPIC、CIBERSORT和CIBERSORT- abs算法。此外,进一步探讨了风险评分在免疫检查点封锁 (ICB)免疫治疗中的潜在作用。实时定量PCR检测HTRA3的表达。
结果: TMB值与老年、男性、早期T状态呈正相关。共筛选到75个TMB相关基因与差异表达基因 (DEGs)的交集基因,并富集于细胞外基质相关通路。基于3个中枢基因的风险评分显著影响总生存 (OS)时间、免疫细胞浸润和ICB相关中枢目标。外部试验组验证了风险评分对预后的影响。构建风险临床图,供临床应用。进一步研究证实HTRA3是肝癌预后的影响因素。最后,TP53突变与风险评分相关,不影响基于风险评分的预后预测。
结论: 综合分析TMB可能会为突变驱动的肿瘤发生机制提供新的见解,进一步有助于个性化的免疫治疗和肝癌的预后预测。
关键词: 肿瘤突变负荷,肝癌,肿瘤免疫微环境,免疫治疗
Fig. 1 Landscape of somatic mutation profiles in HCC samples. A Mutation information of each gene in each sample was shown in the waterfall plot, where different colors with specific annotations at the bottom meant the various mutation types. The barplot above the legend exhibited the number of mutation burden. B Cohort summary plot displaying distribution of variants according to variant classification, type and SNV class. Bottom part (from left to right) indicates mutation load for each sample, variant classification type. A stacked barplot shows top ten mutated genes. C TCGA HCC样品降雨图,每个点都是一个根据SNV类型编码的突变颜色 (Rainfall plot of TCGA HCC sample TCGA−UB−A7MB−01A−11D−A33Q−10. Each point is a mutation color coded according to SNV class.) D 显示肝癌中SNV分布的 (核苷酸)转变及反转,可分为6个转变和反转事件。堆叠条形图显示了MAF文件中每个样本的突变谱分布 (Transition and transversion plot displaying distribution of SNVs in HCC classified into six transition and transversion events. Stacked bar plot (bottom) shows distribution of mutation spectra for every sample in the MAF file. E 突变基因间的一致性和排他性联系 (The coincident and exclusive associations across mutated genes). TMB与年龄的相关性 (The correlation of TMB with age) (F), gender (G) and T status (H)
Fig. 2 Construction of weighted gene co-expression network of HCC samples.
A Sample dendrogram and clinical-traits heatmap was plotted. B Selection of the soft threshold made the index of scale-free topologies reach 0.90 and analysis of the average connectivity of 1–20 soft threshold power. C TMB-related genes with similar expression patterns were merged into the same module using a dynamic tree-cutting algorithm, creating a hierarchical clustering tree. D Heatmap of the correlations between the modules and TMB value (traits). Within every square, the number on the top refers to the coefficient between the TMB level and corresponding module, and the bottom is the P value
Fig. 3 Differential analysis of gene expression data in high- and low-TMB groups and enrichment pathway annotation. A Volcano plot was delineated to visualize the DEGs. Red represented upregulated and green represented downregulated. B Heatmap of top 40 DEGswas drawn to reveal different distribution of expression state, where the colors of red to blue represented alterations from high expression to low expression. C Venn diagram of the hub genes from WGCNA blue module and DEGs. Pathway enrichment analyses of TMB hub genes. D Gene Ontology (GO) enrichment analysis of naïve B cells-related genes: biological processes (BP), cellular components (CC) and molecular function (MF). E KEGG enrichment analysis of naïve B cells-related genes.
Fig. 4 发现组预后风险特征的验证 (Validation of the prognostic risk signature in discovery group). A Heatmap presents the expression pattern of three hub genes in each patient. B 多基因签名风险评分分布 (Distribution of multi-genes signature risk score). C The survival status and interval of HCC patients. D Kaplan–Meier curve analysis presenting difference of overall survival between the high-risk and low-risk groups. E 体细胞突变数分布 (Distribution of somatic mutation count). F 总生存期的单因素Cox回归分析 (Univariate Cox regression analyses of overall survival). G 多因素Cox回归分析总生存期 (Multivariate Cox regression analyses of overall survival).
Fig. 5 预后风险特征的临床意义 (Clinical significance of the prognostic risk signature). A 热图显示每个样本的临床特征,及相应的风险评分的分布情况。高、低风险评分组临床变量亚型的比例 (Heatmap presents the distribution of clinical feature and corresponding risk score in each sample. Rate of clinical variables subtypes in high or low risk score groups). B Age, C Gender, D WHO grade, E clinical stage, F T status, G N status and H M status
文章4:1,699例儿科白血病和实体瘤的泛癌基因组和转录组分析
接收: Nature (Letter)
时间:2018
链接:doi:10.1038/nature25795
摘 要
跨多种癌症类型的分子畸变 (Aberration)分析,被称为泛癌分析,确定在不同谱系的癌细胞中失调的关键生物过程的共性和差异。泛癌分析已用于1~4岁成人癌症,但未用于儿童癌症,这些癌症通常发生在发育中的中胚层组织而不是成人上皮组织。在此,我们对6种组织类型的1,699例儿童白血病和实体肿瘤进行了体细胞改变的泛癌症研究,包括单核苷酸变异、小插入或缺失、结构变异、拷贝数改变、基因融合和内部串联重复,在统一的分析框架下处理了全基因组、全外显子组和转录组测序数据。我们报告了儿科癌症中的142个驱动基因,其中只有45%与成人泛癌症研究中发现的一致;拷贝数改变和结构变异构成了大多数 (62%)的事件。研究确定了11个全基因组突变特征,其中一个是由于8例非整倍体白血病中暴露于紫外线所致。34%的蛋白编码突变检测到突变等位基因的转录,20%表现出等位基因特异性表达。这些数据为儿科癌症提供了一个全面的基因组架构,并强调了儿科癌症特异性发展精确治疗的必要性。
对儿童肿瘤组临床试验中登记的1,699名儿童癌症患者的配对肿瘤和正常样本进行了分析,包括689例B系急性淋巴母细胞白血病 (B-ALL), 267例T-ALL, 210例急性髓系白血病 (AML), 316个神经母细胞瘤 (NBL), 128个Wilms肿瘤和89个骨肉瘤 (扩展数据图1a-c)。所有肿瘤标本都是在最初诊断时获得的,98.5%的患者年龄在20岁或更小 (参见方法,扩展数据图1d)。
Extended Data Figure 1 | Cohort description and workflow. a, Venn diagram of samples analysed by whole-exome (WES), whole genome (CGI) and whole transcriptome (RNA-seq) sequencing in this cohort.


