Simulation about the Fundamentals of the power electronics-2021-08-07
时间:2022-08-20 15:30:01
Fundamentals of the power electronics
- Case 01: Buck-Boost converter
-
- **Topology**
- **建模分析**
-
- **描述**
- **建模分析**
-
- **问题a**
- **问题b**
- **问题c**
- **Parameters**
- **Simulation**
- **仿真波形**
- 注:python提取psim数据的原始代码
利用psim和python模拟书中的例题,严重计算是否合理。
Psim主要用于仿真,python用于分析仿真后的波形。
PSIM的版本为9.0.3.400
Case 01: Buck-Boost converter
Topology
建模分析
描述
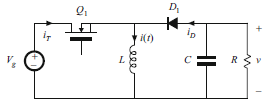
Analysis and design of a buck–boost converter: a practical implementation using a transistor and diode is shown in Fig. 2.
a) Find the dependence of the equilibrium output voltage V and inductor current I on the duty ratio D, input voltage Vg, and load resistance R. You may assume that the inductor current ripple and capacitor voltage ripple are small.
b) Plot your results of part (a) over the range 0 ≤ D ≤ 1.
c) Dc design: for the specifications
Vg = 30V V = ?20V
R = 4Ω fs = 40 kHz
(i) Find D and I
(ii) Calculate the value of L that will make the peak inductor current ripple Δi equal to ten percent of the average inductor current I.
(iii) Choose C such that the peak output voltage ripple Δv is 0.1 V.
d) Sketch the transistor drain current waveform iT (t) for your design of part c). Include the effects of inductor current ripple. What is the peak value of iT ? Also sketch iT (t) for the case when L is decreased such that Δi is 50% of I. What happens to the peak value of iT in this case?
e) Sketch the diode current waveform iD(t) for the two cases of part (d).
建模分析
问题a
v L = L d i L ( t ) d t = v g v_L=L\frac{di_L(t)}{dt}=v_g vL=LdtdiL(t)=vg
i c = − v R i_c=-\frac{v}{R} ic=−Rv
i T = i L i_T=i_L iT=iL
i D = 0 i_D=0 iD=0
当开关管Q1处于关断状态时,此时二极管开通,等效电路如图4所示。
v L = L d i L ( t ) d t = v v_L=L\frac{di_L(t)}{dt}=v vL=LdtdiL(t)=v
i c = − i D − v R i_c=-i_D-\frac{v}{R} ic=−iD−Rv
i T = 0 i_T=0 iT=0
i D = i L i_D=i_L iD=iL
定义开关管Q1导通的时间为D*TS,则可以得到电感电压波形如图5所示。
v g L D T s + v L D ′ T s = 0 \frac{v_g}{L}DT_s + \frac{v}{L}D'T_s = 0 LvgDTs+LvD′Ts=0
由此可以得到输入输出满足
v v g = − D D ′ \frac{v}{v_g} = -\frac{D}{D'} vgv=−D′D
同理可以得到电容电流波形,如图6所示。
− v R C D T s + ( − i D − v R ) C D ′ T s = 0 -\frac{v}{RC}DT_s + \frac{(-i_D-\frac{v}{R})}{C}D'T_s = 0 −RCvDTs+C(−iD−Rv)D′Ts=0
由此可得
i D = − v R D D ′ i_D=-\frac{v}{R}\frac{D}{D'} iD=−RvD′D
至此,问题a已经分析完毕
问题b
问题c
D = 0.4
I = 8.33A
v g L D T s = 2 Δ i L \frac{v_g}{L}DT_s=2\Delta i_L LvgDTs=2ΔiL
所以电感L满足:
L = v g D T s 2 Δ i L L=\frac{v_gDT_s}{2\Delta i_L} L=2ΔiLvgDTs
v R C D T s = 2 Δ v C \frac{v}{RC}DT_s=2\Delta v_C RCvDTs=2ΔvC
所以电容C满足:
C = v D T s 2 Δ v C C=\frac{vDT_s}{2\Delta v_C} C=2ΔvCvDTs
基于以上分析,可以求得电感值L = 180uH,电容值C = 250uH。
问题d和e 可以根据仿真结果进行分析,在此不在给出
Parameters
Vin=30V;V=-20V; R = 4ohm;fs=40kHz
Simulation
仿真波形
注:python提取psim数据的原代码
import pandas as pd
import matplotlib.pyplot as plt
import numpy as np
# csv_path 表示要读取的csv文件的路径,路径前面需要加r进行转义
# columns 表示对应的数据,和psim中的标记一样,字符串类型
def read_csv(csv_path,columns):
    data = pd.read_csv(csv_path)
    data_columns = data[columns]
    return np.array(data_columns)


if __name__ == '__main__':
    path = r'F:\@inbox\Fundamentals of PE\Case2_1_Buck-Boost.csv'
    column1 = 'Time'
    column2 = 'Vout'
    column3 = 'IT'
    column4 = 'IL'
    col_ID = 'ID'
    col_IC = 'IC'
    Time = read_csv(path,column1)
    Vout = read_csv(path,column2)
    IT = read_csv(path,column3)
    IL = read_csv(path,column4)
    ID = read_csv(path,col_ID)
    IC = read_csv(path,col_IC)
    plt.plot(Time,IC)
    plt.xlim(0,0.02)
    # plt.ylim(-10,10)
    plt.xlabel('Time')
    plt.ylabel('IC')
    plt.show()
如果有任何疑问可以直接联系我,对于内容中的错误欢迎大家提出我们一起讨论修改。
联系方式:
EMAIL:whl1457139188@163.com
QQ:975107705


